

“It is not the man who has too little, but the man who craves more, that is poor.” – Seneca. Black Americans certainly had less money than other Americans in 2019. In 2019, the poverty rate for the United States was 10.5%1, the lowest since estimates were first released in 1959. Poverty rates declined between 2018 and 2019 for all major race and Hispanic origin groups. Two of these groups, Blacks and Hispanics, reached historic lows in their poverty rates in 2019. The poverty rate for Blacks was 18.8%; for Hispanics, it was 15.7%. This post ”Black Poverty Rate is 18.8% in 2019 (4 Charts)” seeks to provide current and relevant information from a trusted source. John Creamer, who wrote this report is an economist in the Census Bureau’s Poverty Statistics Branch.
The historically low poverty rates for Blacks and Hispanics in 2019 reflect gains for race and Hispanic origin groups that have traditionally been disadvantaged compared to other groups over time.
Here’s some Financial Information that you can use!
Jay Harold wrote a post, “5 Musts & 8 Needs of Financial Survival” that provides useful information for people in economic distress. Below are highlights from the post.
Personal Finance and Consumer Protection – Steps for Quicker Financial Relief. MAKE SURE YOUR FAMILY’S BASIC NEEDS ARE MET from the U.S. Treasury Department2.
Assess your financial needs over the coming several months and prioritize necessary expenses. If possible, use your tax refund and Economic Impact Payments for food, medicines, and other items for your family’s well-being, such as:
- Medical care
- Housing and utilities
- Caregiving for children or other family members.
- Telephone and internet to help you stay in contact
- Transportation
IF YOUR BASIC NEEDS ARE MET, PAY YOUR BILLS AND DEBTS
However, if you have trouble keeping up with your bills, be sure to ask for help. You may be able to pay some by the due date and the rest when you have adequate resources. You may be able to renegotiate your payment due dates or the monthly minimum amounts due.
- Mortgage and Housing Assistance
- Mortgage Basics Learn how to read your monthly mortgage statement or understand key mortgage terms, like mortgage forbearance.
- Mortgage Relief Options
- Protections for Renter
- More Assistance on Housing Issues — Government Certified Housing counselors throughout the country can provide advice on buying a home, renting, defaults, foreclosures, and credit issues. These trained professionals provide advice for little or no cost, and they will work with you to discuss your situation, evaluate options, and even help you negotiate with your lenders and servicers. Call 1-800-569-4287
- More Assistance on Credit — Reputable credit counseling organizations are generally non-profit organizations that can advise you on your money and debts, and help you with a budget. Some may also help you negotiate with creditors. There are specific questions you can use when looking for a credit counseling organization to work with you.
You have tools to better your financial life.
Back to the Lesson at Hand
These estimates, released September 15, 2020, are from the Current Population Survey Annual Social and Economic Supplement (CPS ASEC). Changes in surveys over time can make historical comparisons difficult. Using a methodology proposed last year, we can adjust the historical series to account for statistically significant impacts of recent CPS ASEC survey redesigns.
The figure below charts historical poverty rates for each of the major race and Hispanic origin groups and Hispanics in the CPS ASEC.
Adjustments are made for Asians, Blacks, and non-Hispanic Whites because the recent survey changes resulted in statistically significant changes in poverty rates. Poverty rates for Hispanics are not adjusted because the survey changes did not result in statistically different poverty rates.
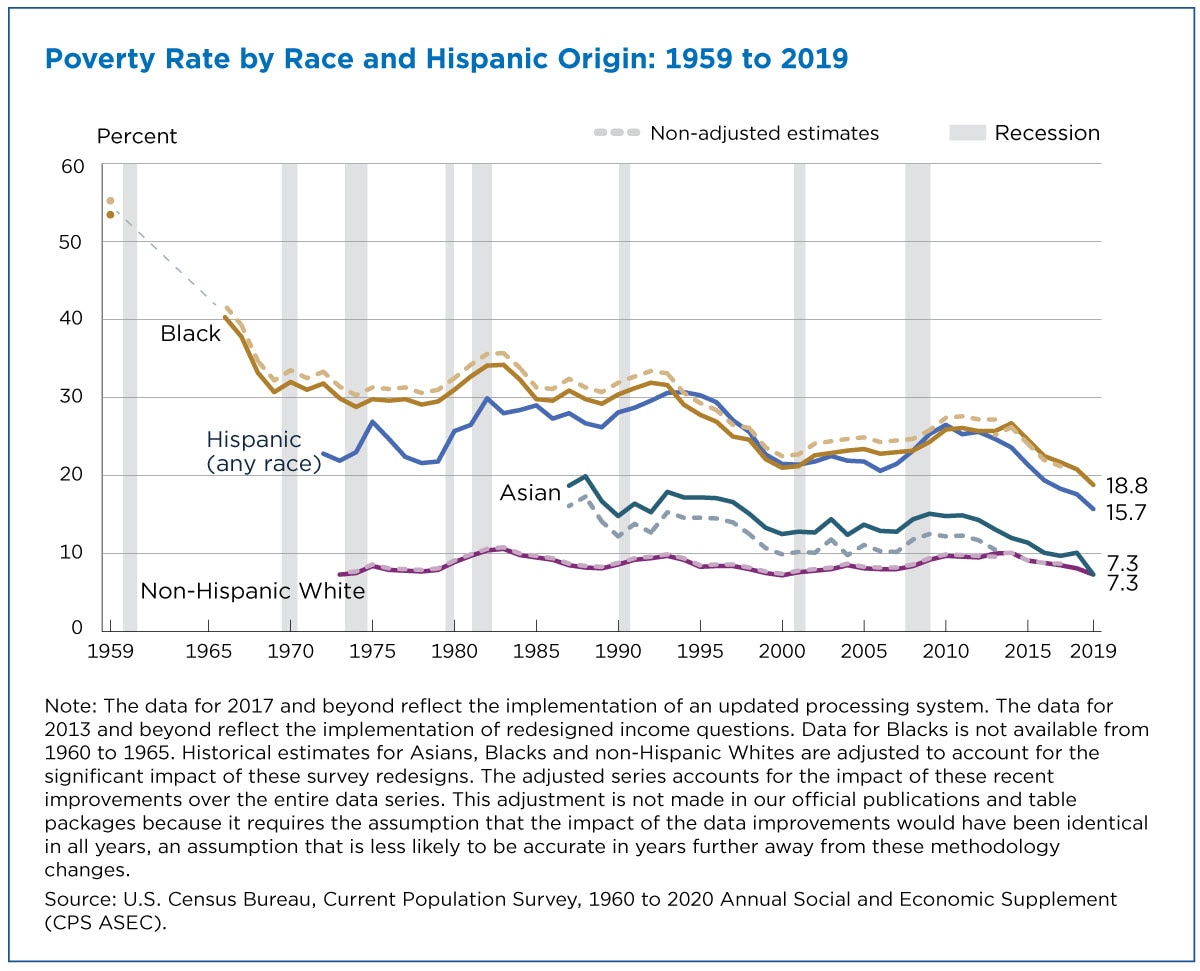
The figure shows that for Blacks, the poverty rate of 18.8% in 2019 was the lowest rate observed since poverty estimates were first produced for this group in 1959. The previous low for this group was 20.8% in 2018.
Poverty rates in 2019 were also the lowest ever observed for Hispanics (15.7%), compared to the prior low of 17.6% in 2018. Poverty statistics for Hispanics date back to 1972.

The Asian poverty rate of 7.3% was also the lowest on record.
The 2019 poverty rate of 7.3% for non-Hispanic Whites was not statistically different than the previous low (historically adjusted) of 7.2% in 2000 and 7.3% in 1973.
Distribution of Poverty by Race and Hispanic Origin
The historically low poverty rates for Blacks and Hispanics in 2019 reflect gains for race and Hispanic origin groups that have traditionally been disadvantaged compared to other groups over time.
However, even with these gains, Blacks and Hispanics continue to be over-represented in the population in poverty relative to their representation in the overall population.
The figure below shows the ratio of people in poverty by race or Hispanic origin group to each group’s share of the total population.
If the poverty population is perfectly proportional to the total population, we would expect the ratio to be 1.0. If a group is over-represented in poverty, the ratio will be greater than 1.0. If the ratio is less than 1.0, the group is under-represented in poverty.
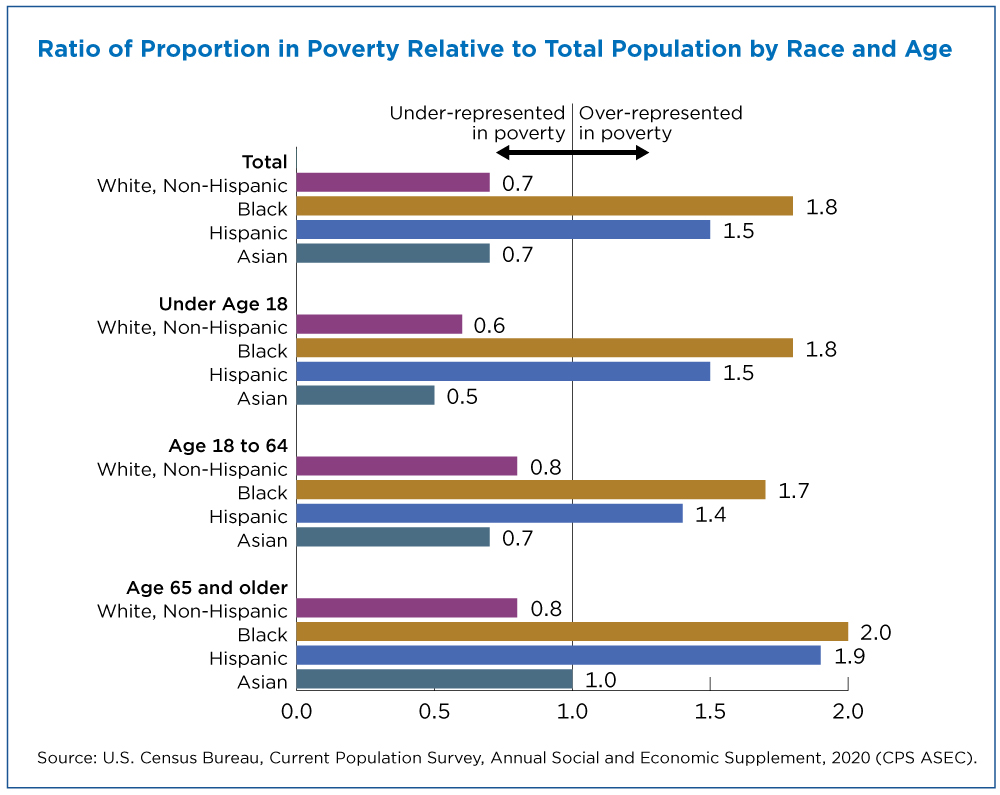
In 2019, the share of Blacks in poverty was 1.8 times greater than their share among the general population. Blacks represented 13.2% of the total population in the United States, but 23.8% of the poverty population.
Hispanic Poverty is Bad
The share of Hispanics in poverty was 1.5 times more than their share in the general population. Hispanics comprised 18.7% of the total population, but 28.1% of the population in poverty.
In contrast, non-Hispanic Whites and Asians were under-represented in the poverty population.

Non-Hispanic Whites made up 59.9% of the total population but only 41.6% of the population in poverty. Asians made up 6.1% of the population and 4.3% of the population in poverty.
These disparities are especially pronounced among children and people ages 65 and older.
The share of Non-Hispanic White and Asian children in poverty was about half of their share in the general population. Among people, ages 65 and over, the shares of Blacks and Hispanics in poverty were approximately twice their share in the general population.
The figure below shows that over time, non-Hispanics Whites have consistently been under-represented among the population in poverty, while Blacks and Hispanics have consistently been over-represented. Asians have been under-represented in poverty for the last 20 years.
The adjustment for survey changes is not made here for simplicity.

The figure shows that there has been a gradual decrease in the degree of over-representation of Blacks and Hispanics in poverty.
After the Great Recession ended in June 2009, the degree of overrepresentation stayed level for Blacks, while the ratio moved closer to one for Hispanics, continuing a trend which started in the mid-1990s.
One potential reason for the recent trend is that since 2008, median household income for Blacks has grown at a slower rate than median household income for Hispanics.
The figure below tracks median household income using 2019 dollars from 2008, the last full year of the most recent recession, until 2019.
Like Figure 1, the series below implements adjustments to the estimates for groups whose median household incomes were statistically changed by the survey improvements.

In 2019, the median household income for Black households was $45,438 compared to $56,113 for Hispanic households, $76,057 for non-Hispanic White households, and $98,174 for Asian households.
Since 2008, median household income increased 14.1% for Black households, compared to 24.3% for Hispanic households, 11.1% for non-Hispanic White households, and 25.7% for Asian households.
For more information on year-to-year poverty changes and household income, see Income and Poverty in the United States: 2019.
Jay Harold hopes you enjoyed this post, “Black Poverty Rate is 18.8% in 2019 (4 Charts)” Please share it and read more about Jay Harold here. Please take this advice from Muhammad Ali and give it back to others. “Service to others is the rent you pay for your room here on earth.”


